
TRADING STRATEGY VALIDATION
Validate your strategy
beyond the backtest.
A convincing equity curve is a starting point. Find out whether the result survives different costs, nearby parameters, unseen periods and different paths.
For traders researching code-based strategies. EdgeVeris connects saved strategy inputs with backtest, validation and risk reports so you can inspect the evidence behind a result.
START WITH THE QUESTION
Strategy validation is not one test.
It is an evidence chain.
How do you know whether a trading strategy is robust enough to trust? Look for consistent, reproducible evidence across tests that challenge different ways the result could be misleading.
No score can certify a strategy as safe. Define the losses, cost increases and performance deterioration you can tolerate before choosing a winner. A failed check is useful information. An unavailable check is missing evidence, not a pass.
Reproducibility
Can you recreate this exact result?
Keep code, inputs, data coverage, sessions, capital and costs together. Compare ordered trades, timestamps, quantities, costs and exit reasons. Matching total profit alone can hide offsetting errors.
Execution & costs
What assumptions created each trade?
Check when a signal becomes executable, bar resolution, order precedence and contract size. Stress plausible commissions and slippage, not just the cheapest scenario.
Search & parameter risk
How much selection happened?
Record tested configurations and manual iterations. Inspect neighboring settings and the full search, not only the winning row.
Out-of-sample evidence
What happens without retuning?
Apply the fixed strategy to a separate chronological period. Define the evaluation and acceptable risk before reading its results.
Robustness
Which reasonable changes break it?
Vary costs, nearby inputs and time blocks. Investigate dependence on one trade, one market episode or an unusually precise setting.
Path risk
How dependent is risk on the sequence?
Compare the original path with explicitly chosen resampling assumptions. Inspect drawdown distributions, not one reassuring median.
Final holdout
Is any independent evidence left?
Use a genuinely unconsulted period after selecting the full procedure. If it changes your choices, it becomes part of development, not a fresh final test.
This is a research framework, not a claim that the platform enforces one mandatory sequence. EdgeVeris allows analyses of saved inputs across stages. Robustness is advisory. The researcher remains responsible for selection and holdout discipline.
SEARCH RISK
The best backtest may be the best accident.
Count the choices, not just the parameters
Overfitting can arise when a strategy captures historical noise that does not persist. A parameter grid is only part of the search. Trying different markets, timeframes, indicators, filters, exits and start dates also creates selection opportunities.
Choosing the best result from many attempts raises the chance of selecting luck. A short parameter list can still hide extensive manual iteration. A high Sharpe ratio alone neither establishes nor diagnoses overfitting.
Keep the uncomfortable evidence
Retain unsuccessful configurations and the order of research decisions. Compare a candidate with nearby inputs and separate periods. Ask whether the gain depends on a sharp optimum, a few trades or a narrow episode.
A broad plateau is encouraging local evidence, not proof. Selecting the most attractive plateau after repeated searches still creates bias. Use optimization for stability to examine the search, rather than repeatedly maximizing one headline metric.
Selection-aware statistics need the search history
PBO/CSCV examines how often an in-sample winner ranks below the OOS median across candidate-matrix partitions. It is not the probability that a live strategy loses money. DSR adjusts Sharpe evidence for selection and non-normality under explicit assumptions. Neither repairs missing trials, data leakage or an incomplete research history.
EdgeVeris exposes these only where the stored evidence supports a diagnostic. Its PBO requires eligible aligned candidate histories. Its DSR diagnostic uses a disclosed raw-trial-count approximation and is not a deployment gate. See the PBO guide and the original methodology.
INDEPENDENT EVIDENCE
Separate the periods. Then protect their purpose.
Development supports exploration. Validation tests a selected specification on a separate period. A final holdout reserves evidence until the strategy and selection procedure are fixed. There is no universally correct split percentage. History length, trade frequency, regime coverage and the refitting process all matter.
If an OOS result changes your next choice, that period has influenced selection. It can remain useful diagnostically, but repeated consultation is not a series of independent confirmations. Simply reopening an unchanged report does not change the experiment. Using its outcome to select parameters, rules or markets does.
Chronological separation also requires correct information timing. Signals must not use unavailable future values. Overlapping trade or label horizons at a boundary may require an appropriate gap or purging. A date split alone cannot fix leakage.
Walk-forward testing evaluates a predeclared rolling training and testing procedure. Each test segment must follow its training segment. Window sizes, refitting frequency and the selection rule are research choices too. Read walk-forward testing and reused holdouts before treating repeated OOS windows as independent proof.
A PRACTICAL REFERENCE
A good test answers a limited question.
“Good” below means acceptable under criteria declared for your use case. These are interpretations, not universal thresholds or a list of guarantees.
On a narrow screen, scroll the table horizontally. Keyboard users can focus the table region and use the arrow keys.
| Test | What it helps detect | What a good result means | What it does NOT prove | Common misuse |
|---|---|---|---|---|
| Validation / OOS | Deterioration outside the development sample. | The fixed specification meets your predeclared criteria in this period. | Future profitability or independence after repeated tuning. | Changing inputs after each OOS result while calling it untouched. |
| Final holdout | Failure of the selected procedure on reserved evidence. | One additional, unselected historical check survived. | Immunity to the next regime or a universal pass threshold. | Choosing among strategies using the final holdout. |
| Walk-forward | Instability of a rolling fit-and-test procedure. | The declared refitting schedule behaved acceptably in its test windows. | That the window lengths or selection rule were not themselves overfit. | Trying many schedules and reporting only the best. |
| Parameter stability | A narrow optimum or fragile neighboring inputs. | Reasonable nearby settings give tolerable outcomes. | An economic mechanism, clean data or freedom from selection bias. | Picking the neighborhood after seeing which one looks smooth. |
| Monte Carlo / resampling | Conditional sequence risk and dependence sensitivity. | Risk remains tolerable under the stated sampling scenarios. | A new market edge, a new OOS sample or future-risk confidence bounds. | Selecting the sampler or block length with the lowest drawdown. |
| Robustness perturbations | Dependence on specific assumptions or episodes. | The strategy tolerates the particular perturbations tested. | Resilience to every shock, regime or execution failure. | Testing only mild changes that cannot challenge the result. |
| Cost stress | Insufficient margin after execution expenses. | Historical net economics tolerate the disclosed cost scenarios. | Achievable fills, capacity, queue priority or market impact. | Subtracting commissions and slippage twice from already-net P/L. |
| PBO / CSCV | Selection instability within a recorded candidate set. | The in-sample winner less frequently fails to rank above the OOS median under the evaluated partitions and tie convention. | The probability of losing money live or correction for unrecorded searches. | Using only the winner or an incomplete, unaligned candidate matrix. |
| Deflated Sharpe ratio | An inflated Sharpe after search and non-normal returns. | Stronger adjusted evidence under the trial-count and return assumptions. | A probability of future profit or complete removal of selection bias. | Treating correlated trials as unquestionably independent. |
| Portfolio diagnostics | Common loss periods and concentrated historical exposure. | Diversification helps on synchronized observations and declared sizing. | Stable future correlations or protection during every crisis. | Adding standalone maximum drawdowns instead of measuring the combined path. |
FIRST-PARTY PUBLIC EVIDENCE · R03
Same observed outcomes.
Different dependence assumptions. Different risk.
Our controlled study uses three differently ordered sequences, each containing 100 profits of $120 and 100 losses of $100. The observed total is always $2,000. Changing the resampling assumption materially changes the simulated drawdown distribution, without changing the original trade outcomes.
Blocks are not automatically more conservative. They preserve local winning and losing structure. That increases this clustered example’s tail drawdown and decreases the alternating example’s. The study also retains shuffled and constant-positive controls instead of publishing only the dramatic result.
Permutation
Shuffle every existing trade once, without replacement. With fixed additive P/L, the terminal total stays fixed. The question is order risk conditional on these exact outcomes.
IID bootstrap
Independently sample individual trades with replacement. Totals can change. Serial dependence is discarded, so that assumption must be defensible.
Block bootstrap
Sample consecutive chunks with replacement. Local order is retained within blocks, but block joins and circular wrapping introduce assumptions of their own.
The free T02 tool demonstrates all three methods. The paid EdgeVeris Monte Carlo report supports permutation and circular block bootstrap. Neither trade-list exercise reruns a strategy against new market prices. For that distinction, see shuffling versus block bootstrap.
For futures, first establish whether the result was constructed correctly. Inspect contract units, rolls, sessions and bar-level execution assumptions before interpreting the validation evidence.
EXECUTION ACCOUNTING · T18
First check the arithmetic.
Then challenge the assumptions.
A plausible gross edge can disappear after costs. Before increasing slippage, identify whether each source result is gross, commission-net or already net of both commission and slippage. Adding a stress scenario to an already-net ledger requires adjusting the known baseline, not subtracting it twice.
- Per side or round turn? A per-side fee applies at entry and exit. Do not double a fee that already covers both.
- Quantity per trade? Count contracts, not just trade rows. Variable size changes both commissions and tick-based slippage.
- Ticks or dollars? Convert ticks using the contract’s tick value. A point is not necessarily one tick.
- Already-net inputs? Reconcile included costs. If their amount is unknown, do not invent a gross reconstruction.
Hypothetical accounting check
Six round trips contain ten round-trip contracts in total. Gross P/L is $900. Commission is $2.50 per contract per side. Slippage is one tick per side at $5 per tick.
$900 − (10 × 2 × $2.50) − (10 × 2 × 1 × $5) = $750 net
One extra tick on each side costs another $100, leaving $650. This example checks units and quantity. It does not establish that the fills are achievable.
Use the free futures backtest cost calculator to reconcile gross versus net and per-side versus round-turn costs. T18 is an accounting sensitivity tool, not a real-fill or market-impact model. In a strategy backtest, inspect signal timing, bar-level stop/target ambiguity and session boundaries separately.
ACTUAL EDGEVERIS WORKFLOW
Keep the inputs attached to the evidence.
The useful distinction is an inspectable research workflow, not the mere presence of Monte Carlo or OOS. EdgeVeris identifies saved inputs within a code version and keeps data and cost context separate. Analyses add reports to that setting instead of turning every stage into an unrelated strategy.
- Identify the result. Select the strategy, code version, input set and data/cost context. A matching input label alone is not enough to compare two runs.
- Inspect the baseline and search. Reconcile the Initial Backtest ledger and execution assumptions. Review optimization candidates and nearby settings before choosing inputs.
- Carry the fixed inputs into evaluation. Compare Development and Validation, inspect robustness perturbations and then use an appropriately reserved Final Holdout. Missing evidence must remain visible as missing.
- Examine risk and retain the report. Inspect Monte Carlo assumptions and distributions. Portfolio diagnostics can add synchronized exposure context. Candidate-bound reports retain the connection to the selected inputs.

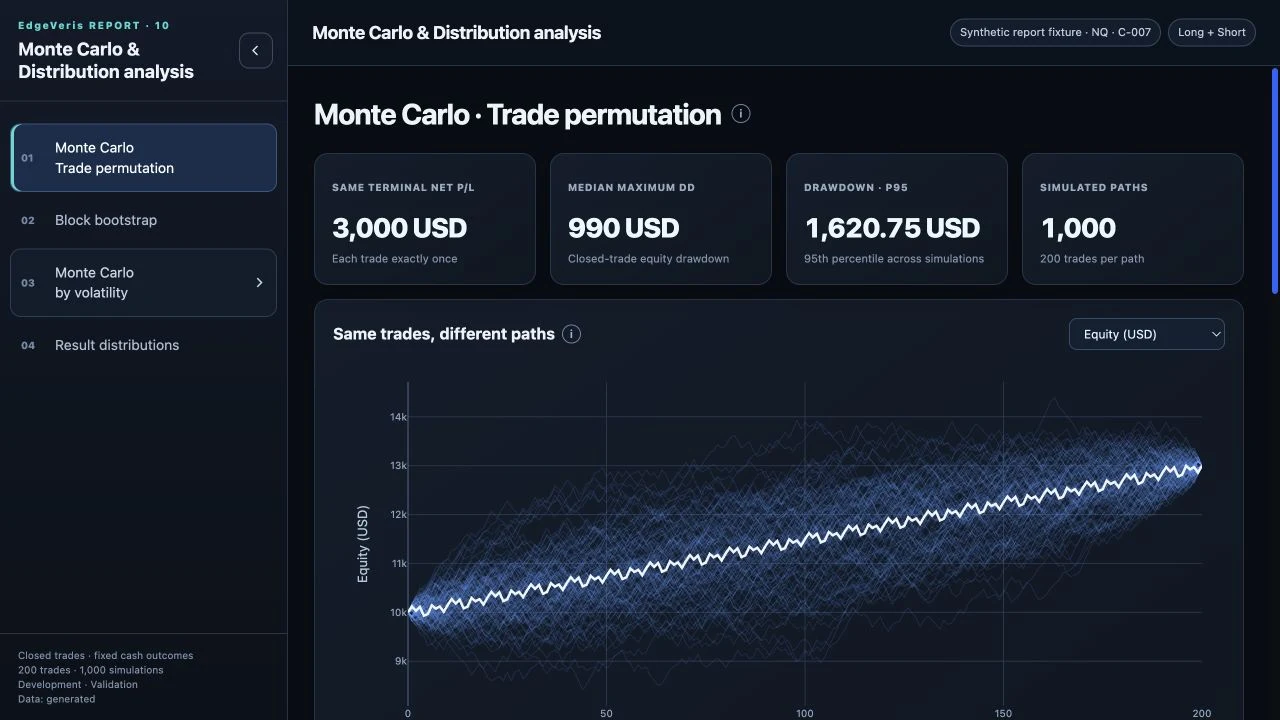
These screenshots substantiate the interface only. No complete public strategy case is presented here because an approved, traceable end-to-end artifact is not available. The reproducible numerical evidence on this page is R03.
KEEP THE CONCLUSION PROPORTIONATE
What strategy validation cannot tell you
- What the next market will do. Future regimes, liquidity and participant behavior can change.
- What a finite sample never contained. More resampled paths do not add independent market observations or model tail mechanisms absent from the inputs and assumptions.
- Whether assumed fills will occur. Bar data, latency, order handling, capacity and market impact can differ from a model.
- How much hidden selection happened. Recorded tests cannot fully correct undocumented research choices or a consulted holdout.
- Whether dependencies will persist. Resampling assumptions, cross-strategy correlations and diversification benefits may fail in a different regime.
- That profitability is guaranteed. Successful historical validation supports a conditional decision. It does not mathematically prove future returns.
Make a decision you can audit
Before proceeding, write down the accepted input configuration, evidence used, risk limits and unresolved assumptions. If performance only survives one precise setting or an optimistic cost model, revise or reject it. If the sample is too narrow, the honest decision may be “insufficient evidence.” No universal number of trades or Sharpe threshold resolves that uncertainty.
Portfolio, seasonal, positioning and macro diagnostics can help explain historical concentration. Post-hoc patterns are hypotheses to test, not established causes or replacement OOS evidence.
FROM A BACKTEST TO AN INSPECTABLE PROCESS
Build your validation workflow.
Keep strategy inputs, evaluation periods and risk reports connected in EdgeVeris.
Methodology references
For the statistical definitions and assumptions behind the discussion:
- Bailey, Borwein, López de Prado & Zhu — The Probability of Backtest Overfitting
- Bailey & López de Prado — The Deflated Sharpe Ratio
- Dwork et al. — The reusable holdout: Preserving validity in adaptive data analysis
- arch documentation — Time-series bootstrap constructions
Public methods and tools are available without an account. Product screenshots captured October 8, 2026. Method explanations are not investment advice.