
INSIDE ALGORITHMIC TRADING WORKSPACE
From idea to strategy. Every insight connected.
Research your edge. Build your strategy.
See how it all works together.
MARKET DATA & PROP PROGRAMS
CME FuturesCME OptionsDatabentoCFTC COT ReportsFRED Economic DataALFRED Historical VintagesFTMOApex Trader FundingTopstep
STRATEGY WORKFLOW
- 01Research
- 02Initial Backtest
- 03Optimization
- 04Validation
- 05Robustness
- 06Freeze
- 07Final Holdout
- 08Prop Evaluation
- 09Options & Market Context
- 10Monte Carlo & Distribution
- 11COT
- 12Seasonality
- 13Macro
- 14Exit Efficiency
- 15Final Report PDF
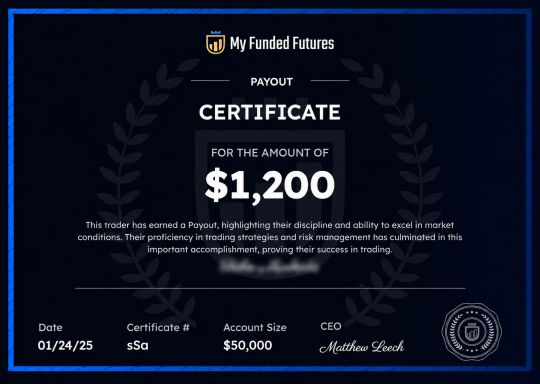
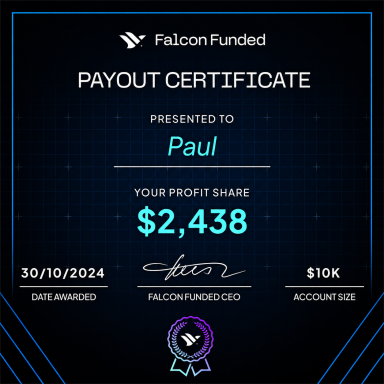
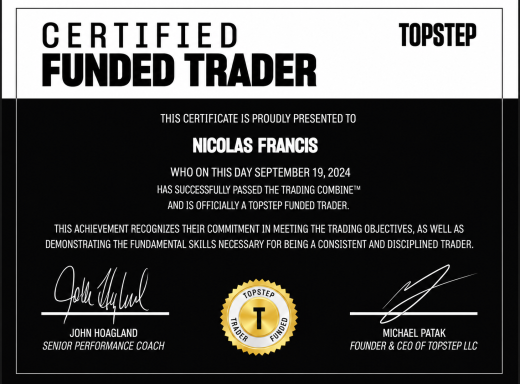
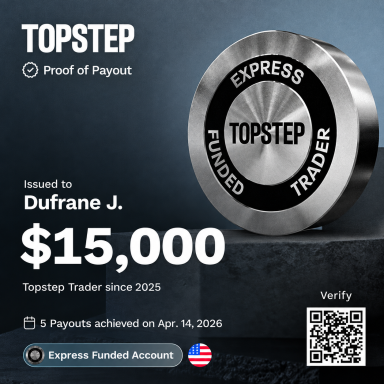
We’ve helped traders like you.

FAQA better question.
A better question.
A deeper understanding.
Get to know the research workspace behind your next strategy.
What is EdgeVeris?
EdgeVeris is a research and validation workspace for systematic trading strategies. It brings strategy code, historical data, backtesting, optimization, out-of-sample validation, robustness testing, Monte Carlo simulations, prop evaluations, options context, portfolio analysis and PDF reporting into one connected workflow.
Instead of treating an attractive equity curve as the final answer, EdgeVeris helps you investigate how the result was created, what risks may be hidden inside it and whether the strategy holds up beyond the data used to develop it.
Who is EdgeVeris built for?
EdgeVeris is designed for systematic traders, strategy developers, quantitative researchers and prop traders who want to evaluate rule-based trading ideas through a structured research process.
It is suitable for experienced Python users as well as traders who use an AI assistant to turn clearly defined trading rules into compatible code. EdgeVeris is not a signal service, copy-trading platform or discretionary charting terminal.
What if I don’t know how to code?
Your trading idea comes first — you do not have to write every line yourself.
Describe your entry rules, exits, filters and risk management to an AI assistant such as ChatGPT, Claude or Grok, and ask it to create Python code that follows EdgeVeris’s strategy requirements. The AI Instructions button gives you a ready-to-copy specification for your chosen assistant.
Paste the resulting code into EdgeVeris, review it carefully and confirm that it matches your intended rules before starting the analysis. AI-generated code can contain mistakes and should not be treated as automatically valid.
What do I need to run my first analysis?
Start with a trading idea, clearly defined entry and exit rules and a compatible Python strategy.
Choose your instrument, timeframe and date range, provide supported historical data and configure your position sizing and trading-cost assumptions. Paste or upload your code, review it in the editor, create the strategy and run your first analysis.
No live brokerage connection is required to analyse historical data.
Can I use my own Python strategy and data?
Yes. You can bring your own Python strategy together with compatible CSV or Parquet price history, select the relevant instrument and date range and keep the entire research process inside one workspace.
You can also use the supported Databento connection with your own credentials and compatible source data. Available historical coverage, resolutions and instruments depend on the selected provider, dataset and subscription tier.
How does EdgeVeris help reduce overfitting?
EdgeVeris separates strategy development from evaluation on unseen data.
You can optimize and compare parameters on a development period, examine candidates on separate validation data, freeze the selected configuration and optionally evaluate it on a final holdout that was not used during development.
Parameter stability analysis, robustness tests, Monte Carlo simulations and distribution-based diagnostics help reveal whether performance depends on a narrow parameter choice, a small number of trades or unusually favourable market conditions.
These tools can reduce the risk of overfitting, but they cannot eliminate it completely.
What’s included, and are there any additional data costs?
Available features, usage limits and data access depend on your subscription tier. The Pricing page provides a direct comparison of the available plans.
Elite brings together the full research workflow, including backtesting, optimization, validation, robustness, frozen candidates, prop simulations, options analytics, Monte Carlo, portfolio analysis and PDF reporting. It also includes COT, macro, CPI and NFP analysis, seasonality, Exit Efficiency, the code library and reusable input sets.
Third-party data charges are not automatically included unless explicitly stated. When using your own data-provider account, such as Databento, the provider’s pricing and licensing conditions continue to apply.
Can I explore EdgeVeris before I commit?
Yes. The 24-hour paid trial costs $7.99 USD and gives you full Elite access for 24 hours after payment is confirmed.
You can work with your own strategies, data and analyses and explore the complete workflow before choosing a longer subscription.
The trial is a one-time purchase and does not renew automatically. It does not automatically convert into a subscription when the 24-hour period ends.
What happens when the trial ends?
Your trial access ends after 24 hours unless you separately choose a subscription.
The trial does not initiate an automatic recurring payment. Your own strategy code and source data remain your files, while continued access to subscription features and new analyses requires an active plan.
Does EdgeVeris guarantee that a strategy will be profitable?
No. EdgeVeris helps you perform more structured and rigorous historical research, but no backtest, robustness test or simulation can guarantee future trading performance.
Market conditions change, execution may differ from historical assumptions and previously observed relationships can weaken or disappear. All results should be treated as research evidence rather than a promise of future returns.
EdgeVeris is designed to help you ask better questions before putting confidence in a strategy — not to remove uncertainty from trading.
24-HOUR PAID TRIAL · FULL ELITE ACCESS
Your next idea.
Your next idea.
Every feature to explore it.
24 hours after confirmed payment. One-time purchase. No automatic renewal.
- COT, macro regimes & CPI/NFP analysis
- Seasonality, Exit Efficiency & portfolio analysis
- Code library, input sets & the full 15-stage workflow